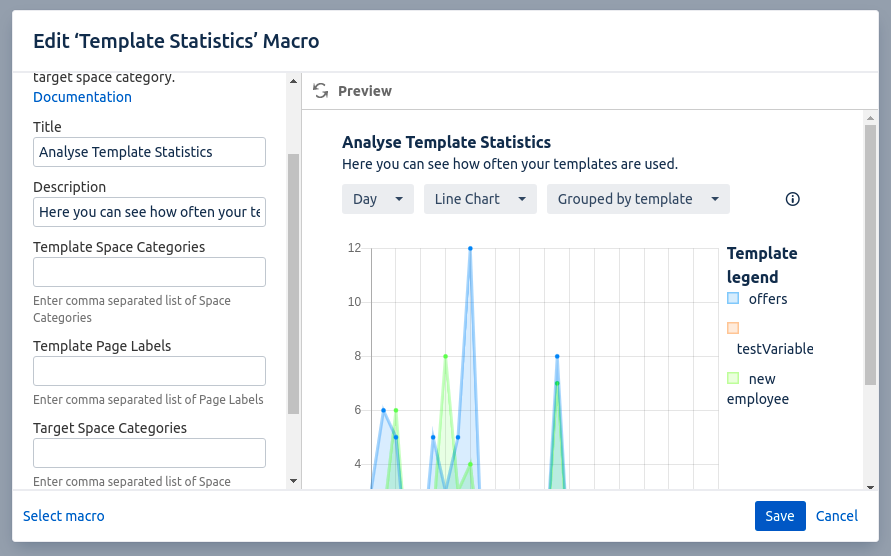
The template statistics macro allows you to analyze your template usages.
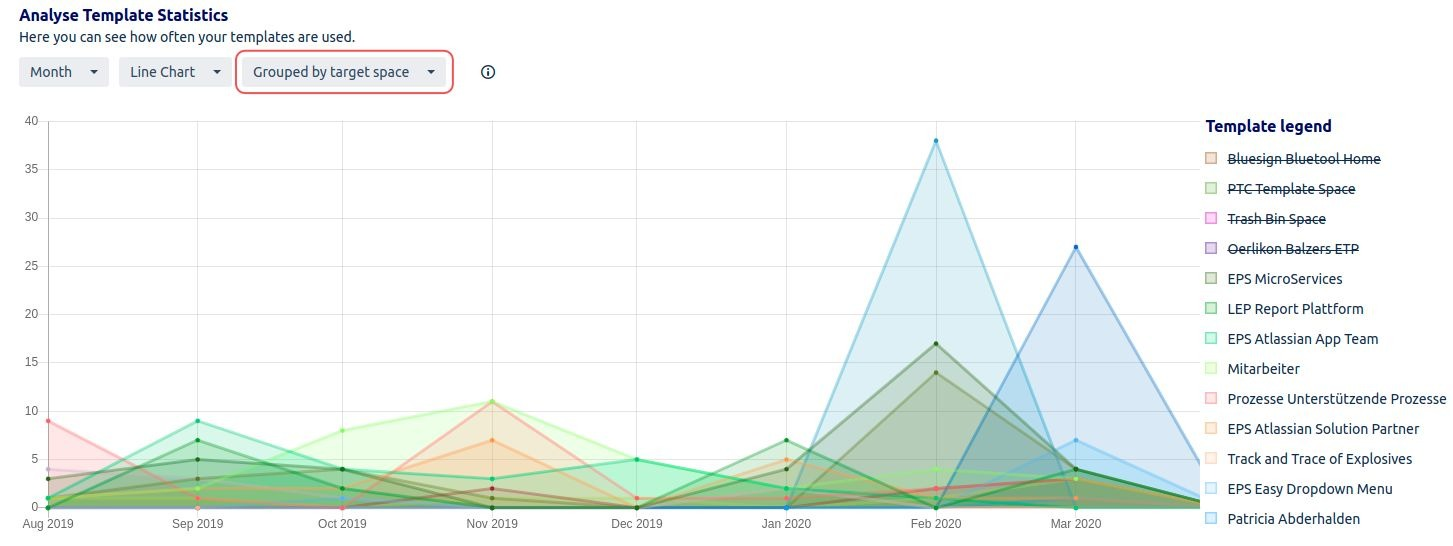
The accumulated usages are grouped by template, by template space or by template target space. You can also filter your data with space category and page labels.
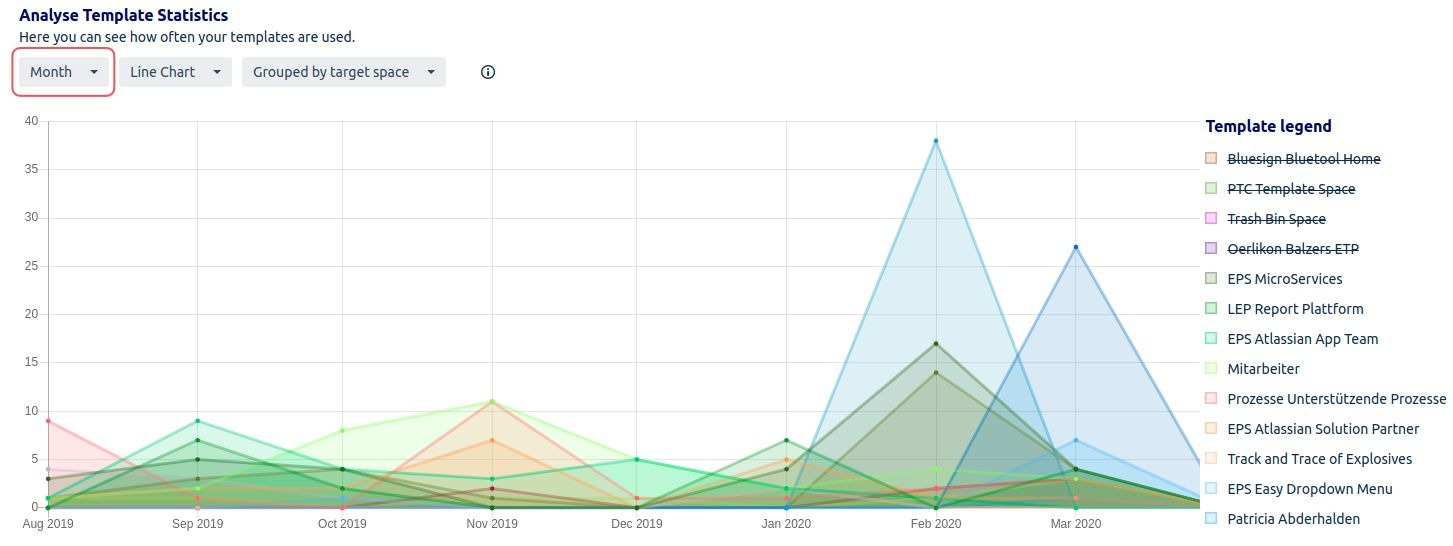
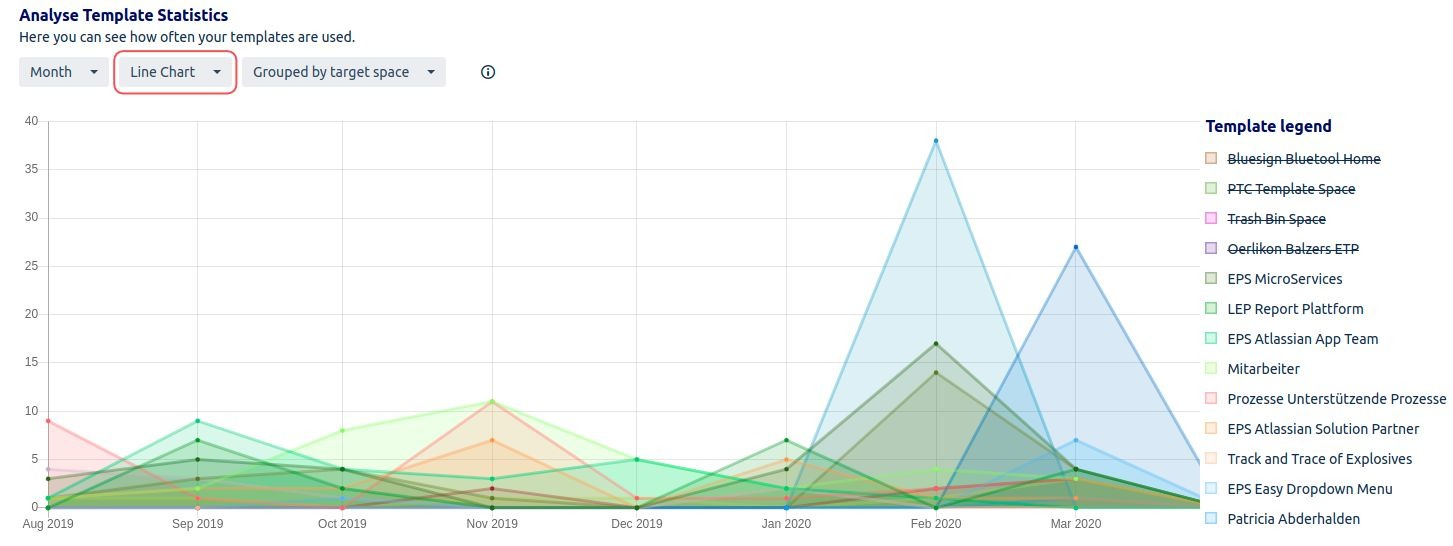
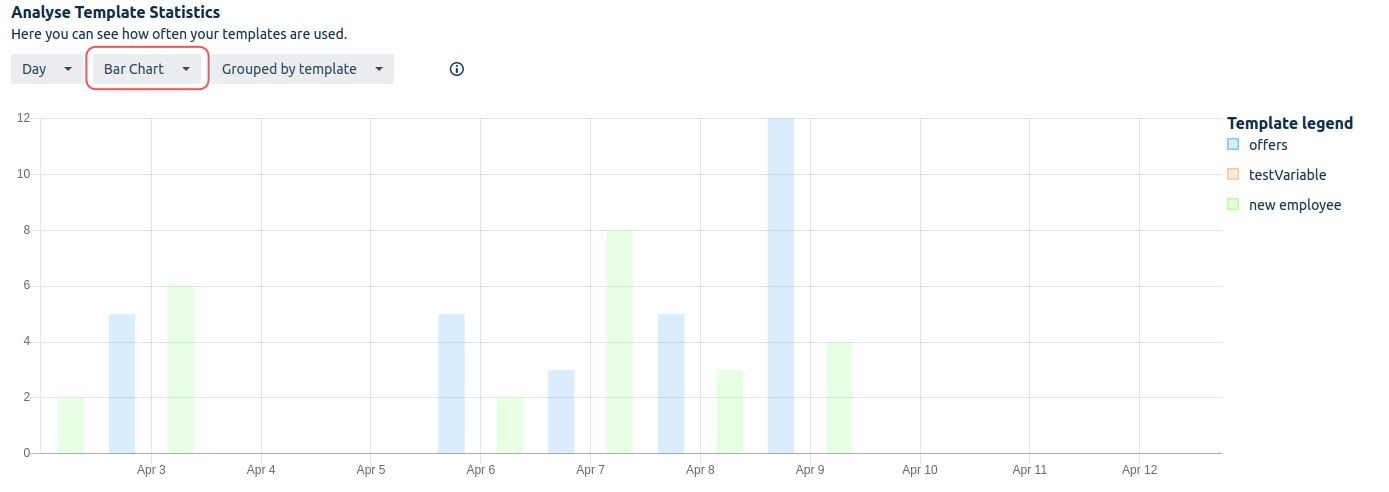
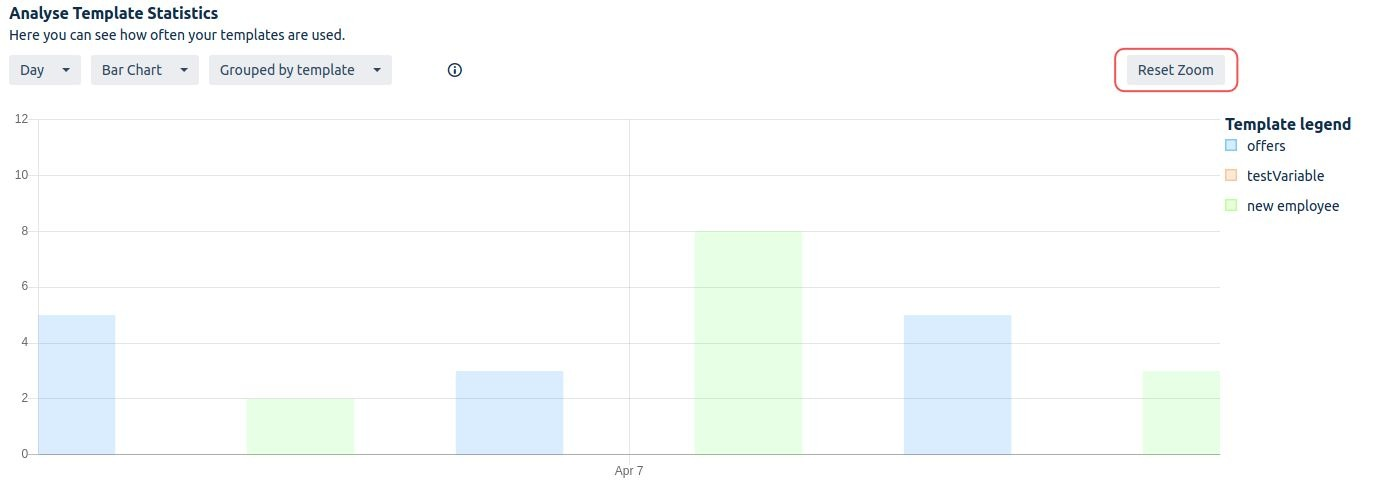
The statistics can be displayed in a line or bar chart. This chart is scalable by day, week, month, quarter and year.
Macro Parameters
|
Parameter |
Description |
|---|---|
|
Title |
Set a title for your chart |
|
Description |
Set a description for your chart |
|
Template Space Categories |
With this filter you can set the template space for the analysis. You have to add the category of the template space. You can add a category to your template space in the space tools. If you need help to add a category to a space read this article . You can add more than one category to the parameter, for this you need to separate them with a comma e.g. category1, category2, category3 That means it is possible to analyze templates from different template spaces in one chart. |
|
Template Page Labels |
Ability to limit your data even more. Add the template page label to this filter. Here you are also able to add several labels for this and separate them by a comma e.g. label1, label2, label3 |
|
Target Space Categories |
With this filter you can restrict your target spaces. That means you can analyze how often a template is used in a specific space. For this you have to add the space category of the target space. You can add several categories for this. You need to separate them with a comma e.g. category1, category2, category3 |
|
Exclude |
With this checkbox you can set if the target spaces should be included in the accumulated usages or excluded. |
Chart handling
Scaling
|
Interval |
Description |
|---|---|
|
Day |
The usages are accumulated by day. |
|
Week |
The usages are accumulated by week. They are calculated from Monday to Sunday and the results are printed in the chart on the date of Sunday. |
|
Month |
The usages are accumulated by month. The result is printed on the first of the month. |
|
Quarter |
The usages are accumulated by quarter. Q1 => 1. January - 31. March Q2 => 1. April - 30. June Q3 => 1. July - 30. September Q4 => 1. October - 31. December |
|
Year |
The usages are accumulated by year and the result is printed on the 1. January of the year. |
Chart Type
|
Type |
Description |
|---|---|
|
Bar Chart |
The results are printed in a bar chart. |
|
Line Char |
The results are printed in a line chart. |
Grouping Strategy
|
Type |
Description |
|---|---|
|
Grouped by template |
The usages are sorted by template. You can simply find out how often a template was used. Remember your settings in the macro parameters. If you have restricted your data to a specific target space you will only see the usages in this target space. |
|
Grouped by template space |
The usages are sorted by template space. With this you can find out how often templates from your chosen template space were used. |
|
Grouped by target space |
The usages are sorted by target space. With this strategy you can find out how often your chosen templates were used in a specific target space. Remember the data is based on your filter parameters which you can define in the macro browser. |
Legend
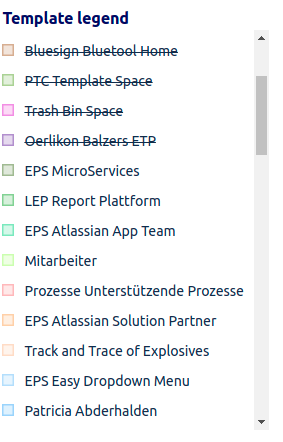
The legend shows you the name of the space or the name of the template, this depends on your grouping strategy. If you want to disable the data of a space or a template you can simply click on the name and the graph will disappear.
Zoom
You can zoom into your data. The zoom is limited in the bar chart, if you have reached the limit you can reset it via the reset button.
Error handling guide
Could not find any template
If this warning is shown the template statistics macro could not find any template. To solve this issue you should check your filters in the macro Parameters.
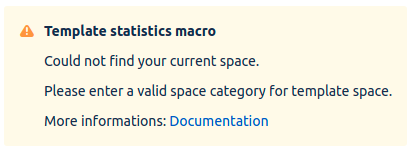
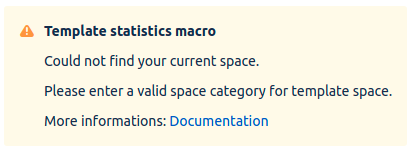
Could not find your current space
If this warning is shown the template statistics macro could not find your current space. To solve the problem you have to add a valid space category to the template space category.
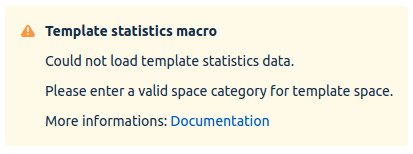
Could not load template statistics data
If this warning is shown the template statistics macro could not load the statistics data. To solve this issue please check your connectivity to the server.
If this error is shown you have to add a valid space category to the template space category.

